P617
Constipation refers to irregular bowel movement that is either infrequent or difficult to pass. As a prevalent condition, it impacts 14% of the world’s population. In addition to physiological distress, constipation is associated with poor patient satisfaction with treatment, impairment of quality of life, and reduced productivity.
A recent retrospective study aimed to elucidate possible contributing factors to constipation, in particular dietary fiber and liquid intake. Measures were recorded for subject stool consistency and dietary consumption with intake of fiber and liquids. Univariate analysis for factors associated with constipation was performed. The criteria for statistical significance was a P-value of <0.05.

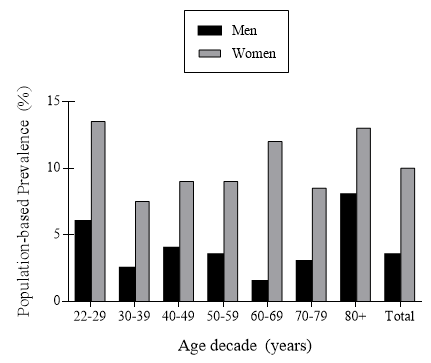
Figure 1. The prevalence of constipation by age and gender. Total gender difference was significant with P<0.001. Dichotomization of age into >60 and <60 years of age showed no significant differences, P>0.05.

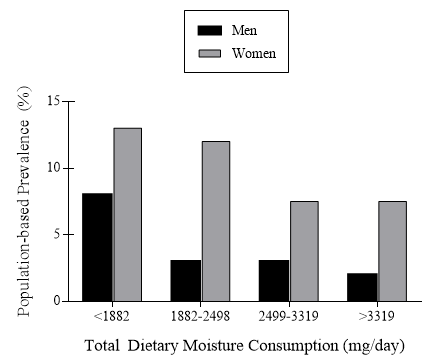
Figure 2. Constipation prevalence in relation to dietary moisture intake. Quartile differences were significant, P<0.05.
Table 1. Dietary fiber intake among men and women with and without constipation. P-values were derived from two-sample proportion tests for individual quartiles.
| Quartile of Fiber Intake | Men (n = 3918) | Women (n = 4257) | ||
| No Constipation (%) |
Constipation (%) |
No Constipation (%) |
Constipation (%) |
|
| Lowest Quartile (<10.1 g/day) |
17.3 | 30.5 | 27.1 | 32.8 |
| Middle Lower Quartile (10.1 to 14.5 g/day) |
22.3 | 19.4 | 26.4 | 28.2 |
| Middle Upper Quartile (14.5 to 20.1 g/day) |
27.1 | 26.7 | 27.2 | 24.3 |
| Highest Quartile (>20.1 g/day) |
33.3 | 23.4 | 19.4 | 14.7 |
Table 2. Univariate analysis of factors associated with constipation. Results from Body mass index and vigorous physical activity were found not to be statistically significant.
| Overall Constipation Prevalence | Men (n = 4586) | Women (n = 4787) | ||
| Number | (%) | Number | (%) | |
| 221 | 4.0 | 518 | 10.2 | |
| Race/Ethnicity | 4586 | 4787 | ||
| Hispanic | 50 | 6.3 | 89 | 9.4 |
| Non-Hispanic White | 88 | 4.3 | 243 | 9.9 |
| Non-Hispanic Black | 55 | 4.0 | 126 | 12.6 |
| Education | 4584 | 4785 | ||
| Less than high school | 94 | 5.4 | 152 | 12.2 |
| High school or GED | 59 | 5.4 | 151 | 12.1 |
| More than high school | 68 | 2.8 | 214 | 8.8 |
| Family Poverty Income Ratio | 4586 | 4787 | ||
| <2 | 121 | 5.9 | 547 | 11.4 |
| ≥2 | 100 | 3.2 | 493 | 10.3 |
| Body Mass Index | 4556 | 4756 | ||
| <25.0 | 68 | 5.2 | 188 | 11.4 |
| 25.0-29.9 | 85 | 3.7 | 161 | 11.1 |
| ≥30 | 67 | 3.5 | 166 | 8.3 |
| Self-rated health | 4586 | 4787 | ||
| Excellent/very good/good | 151 | 3.7 | 377 | 9.7 |
| Fair/poor | 70 | 5.9 | 141 | 12.7 |
| Vigorous Physical Activity | 4585 | 4787 | ||
| No | 143 | 4.6 | 220 | 10.5 |
| Yes | 78 | 3.4 | 117 | 9.6 |
.
Find an error? Take a screenshot, email it to us at error@mytestingsolution.com, and we’ll send you $3!
